Building a Zero-Cost Click Heatmap
I've always been fascinated by the idea of building something from scratch. It's a way to understand the inner workings of the system and to appreciate the elegance of simplicity. I've been using tools like mouseflow.com and heatmap.com for years, but I've always wondered if there was a way to build something similar from scratch.Commercial heatmap tools are often expensive and inject heavy scripts into your website. For a minimal microblog, that is an anti-pattern.
So, I built a serverless, local-first click heatmap from scratch.
The Architecture
- Capture: A tiny Vanilla JS script tracks click coordinates as percentages (to support responsive layouts) and sends them away using
navigator.sendBeacon. - Storage: The data streams through AWS API Gateway and Kinesis Firehose, saving directly as raw log files on Amazon S3. Idle cost is exactly $0.
- Render: A local Go script downloads the logs, aggregates the coordinates, and a local HTML5 Canvas overlays the glowing heat points directly over the blog interface.
First Insights
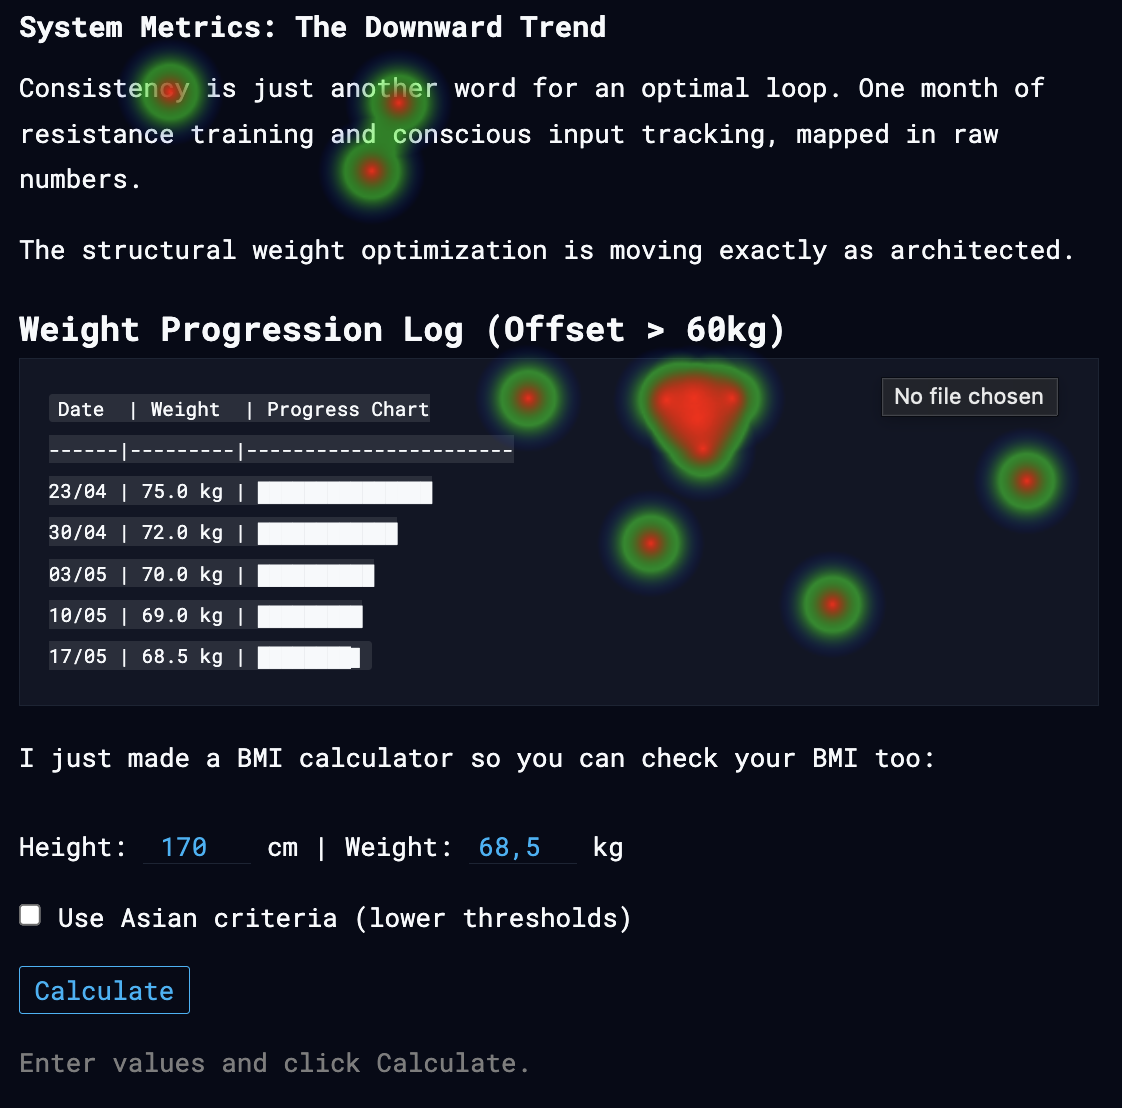
Looking at the telemetry from my recent weight-tracking post, the data reveals clear user behavior:
- Readers heavily click and interact with the raw ASCII progression table.
- There is high engagement at the bottom where the custom interactive BMI calculator sits.
Zero external dependencies. Zero monthly costs. 100% data privacy.